Getting started
The City Energy Analyst 2.1 is stored in a public repository in Github under the name of CEAforArcGIS.
Folder Structure
The repository contains the following folders:
- cea
- analysis
- databases
- demand
- geometry
- optimization
- plots
- resources
- technologies
- utilities
- examples
- tests
- docs
- bin
- euler
- setup
- tests
cea
Contains the source code (human readable) of the different modules of CEA. This is the core of CEA and is divided in the next sub-folder structure:
cea/analysis
Contains scripts to analyze the results of all simulations in CEA.
cea/databases
Contains default data of weather, technology, occupancy, costs etc.,
cea/demand
Contains scripts to calculate the demand of energy in buildings
cea/geometry
Contains scripts to manipulate and read building geometry.
cea/optimization
Contains scripts aiming to optimize the energy system of a district.
cea/plots
Contains scripts to plot information.
cea/resources
Contains scripts to analyze the potential of energy sources.
cea/technologies
Contains scripts for the simulation of different technologies.
cea/utilities
Contains functions needed by any other script frequently.
cea/examples
Contains an open source case study to test the cea.
cea/tests
Contains unitest data and scripts necessary ot run our automatic code checker in Github.
docs
Contains the developers manual of the CEA.
euler
Contains source code needed to connect to the cluster of 50K cores called Euler at ETH Zurich (Only researchers at ETH Zurich can use this).
CEA workflow
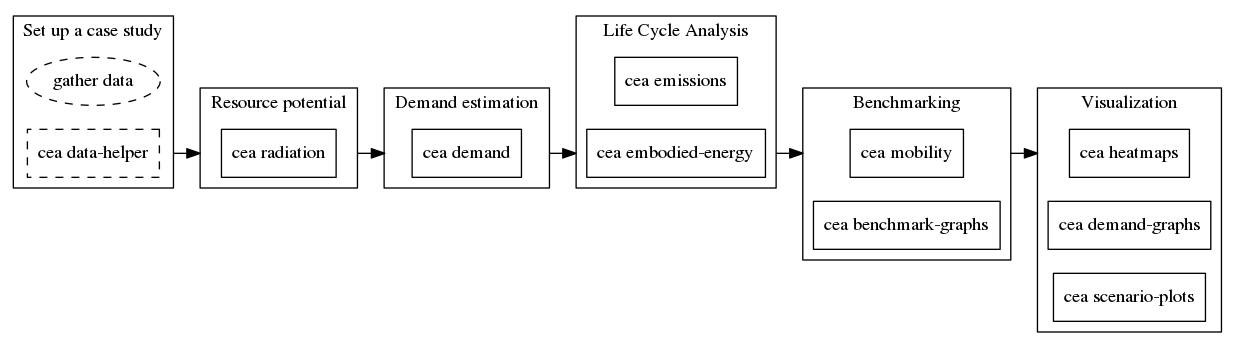
The main workflow of CEA is:
Set up a case study
If you want to run a case study different from those available in the ‘examples’ folder. This step entails preparing a case study to have:
- the same folder structure as one of our case studies in the ‘examples’ folder.
- the exact number, names and attributes tables of the input shapefiles.
- the exact name and content of the digital elevation model of the terrain.
The CEA users manual includes a great deal of hints to both gather and format these data for CEA using ArcGIS or any other geographical information system.
Further, the command cea data-helper can apply archetype information to a subset of the input files to generate
the others.
Resource potential
Once a case study is created the solar radiation incident in every surface is calculated.
- run cea radiation
Demand estimation
Calculate the demand of energy services for every building in the area.
- run cea demand
Life Cycle Analysis
Calculate the emissions and primary energy needed due to the construction, operation and dismantling of buildings in the area.
- run
cea emissions - run
cea embodied-energy
Benchmarking
In case you have more than one scenario inside the case study, this step calculates targets of performance according to the 2000-Watt Society approach. The approach also calculates the LCA of vehicles in the area.
- run
cea mobility - run
cea benchmark
Visualization
There are different ways to visualize and plot all the raw data described until now. You can either map it using ArcGIS (we expect you to know how through our user’s manual), or run the different scripts we included for this.
- for heatmaps of demand or LCA run
cea heatmaps- currently, you will need ArcGIS for this. - for plots of demand run
cea demand-graphs - for plots of benchmarking run
cea scenario plots