How to Run MPC Building Toolbox
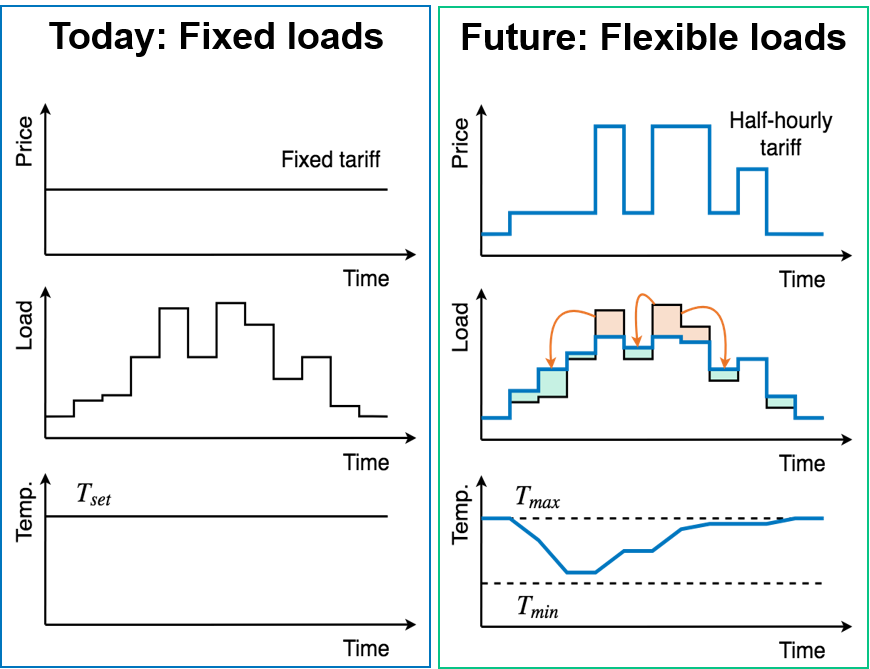
The MPC Building Toolbox utilize Model Predictive Control (MPC) algorithms to minimize the electricity costs for cooling in buildings. When the hourly electricity prices are flunctuating, it is possible to explore the opportunities to shift the cooling loads by precooling the buildings (as shown in the figure below).
Input
Range of the building temperature according to thermal comfort standard.
Hourly electricity price. The database is located here:
..\CityEnergyAnalyst\cea\databases\Region\systems\electricity_costs.xlsx
Prerequisites
#. Install the license of Gurobi in your computer. you can obtain one in gurobi.com for free for academic purposes. #. Add Gurobi package to the cea environment:
*open anaconda
*do ``conda env update``
*do ``activate cea``
*do ``grbgetkey xxxxxxxxxxxxxxxxxxxxxxxxxxxxxx``
(where xxxxxxxxxxxxxxxxxxxxxxxxxx is the key of your license.)
If you are having problems running from pycharm. get today’s version 06.03.2019 or later one. This includes a fix to paths in conda.
Steps
Run demand simulation of the case study you wish to optimize.
Assign optimization parameters in
cea.config:[mpc-building] time-start = 2005-01-01 00:00:00 time-end = 2005-01-01 23:30:00 *set-temperature-goal = constant_temperature, follow_cea, set_setback_temperature constant-temperature = 25.0; if the set-temperature-goal = constant_temperature *pricing-scheme = constant_prices, dynamic_prices constant-price = 255.2; [SGD/MWh] *min-max-source = constants, from occupancy, from building.py min-constant-temperature = 20.0 max-constant-temperature = 25.0 delta-set = 3.0; if min-max-source = from occupancy delta-setback = 5.0; if min-max-source = from occupany
Run ceaoptimizationflexibility_modelmpc_buildingoperation_main.py
Check results from optimization in
...scenario\outputs\mpc-building
Outputs
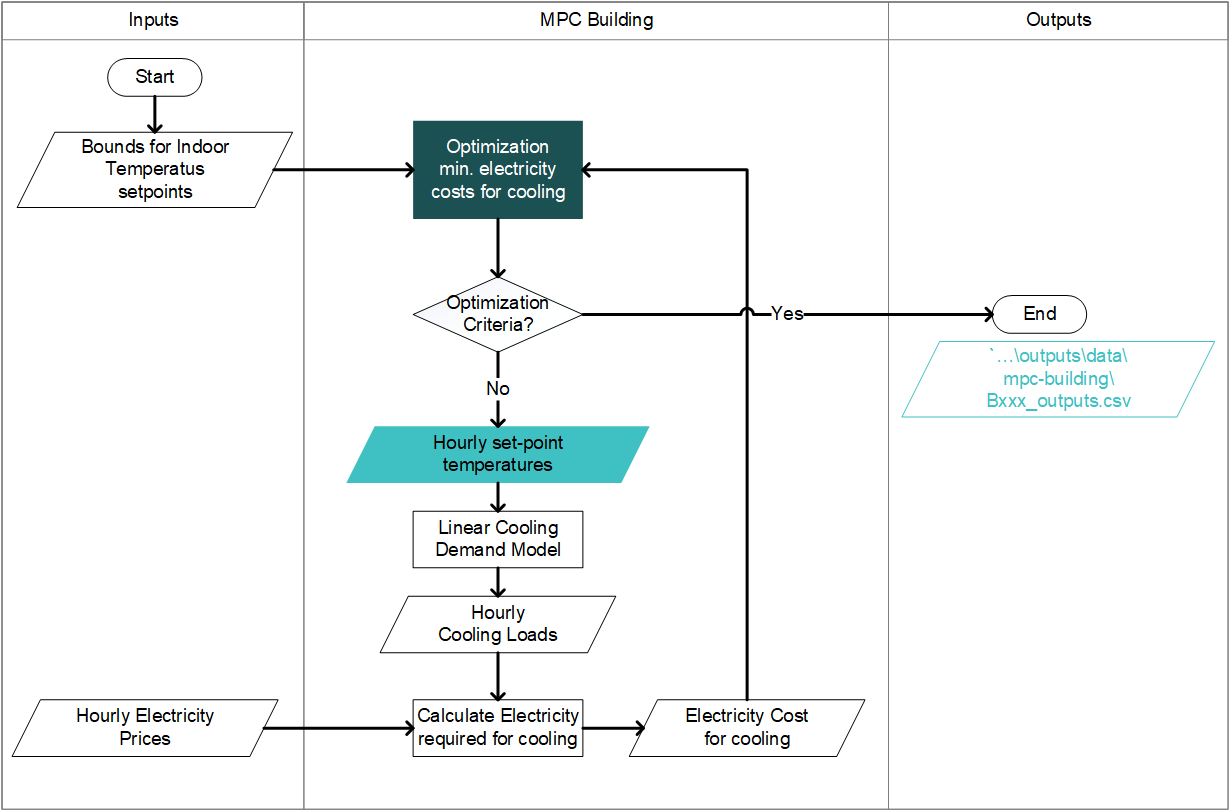
The results from the optimization are saved for each building. In Bxxx_outputs.csv you will find:
Hourly temperature set-points for each function in the building
Hourly air flows
Hourly electricity consumption for cooling
Calculation flowchart
** Please note: To maintain linearity, the cooling demand is calculated by a linearized model instead of the CEA demand module.